Clinical data alert
Background
Comprehend (YC W11) is a business intelligence tool for clinical trials. The tool helps the clinical operations teams to ensure the studies are 1) on time and on budget, and 2) monitor the data quality.
According to the 2016 Clinical Benchmark Report, 85% of clinical executives surveyed indicated that the decisions made during trials were based on outdated data and took too long. How can we help users to start investigating problem areas earlier? Our goal was to allow technical users to set up metric based alerting, so that the operations team can proactively investigate problematic sites.

My Role
I shipped this project in collaboration with a fellow designer and team of developers. I led the concept development, interaction and visual designs, as well as played an active role in the product strategy: what should we build? Who are we building it for?
Requirements Gathering
As a startup, we went through some transitions. All of a sudden we dropped from having three product managers to one. I stepped in to help gather requirements from customers and stakeholders, and manage the project timeline.
Wireframes To Help Project Scoping
I used wireframes to facilitate discussions around project expectations e.g. what is our MDP (minimal desirable product) feature set? It turned out that a lot of the functions the team initially thought were important did not fit into the MDP criteria and were therefore postponed to version two of the project.

Interviews & Updating Personas
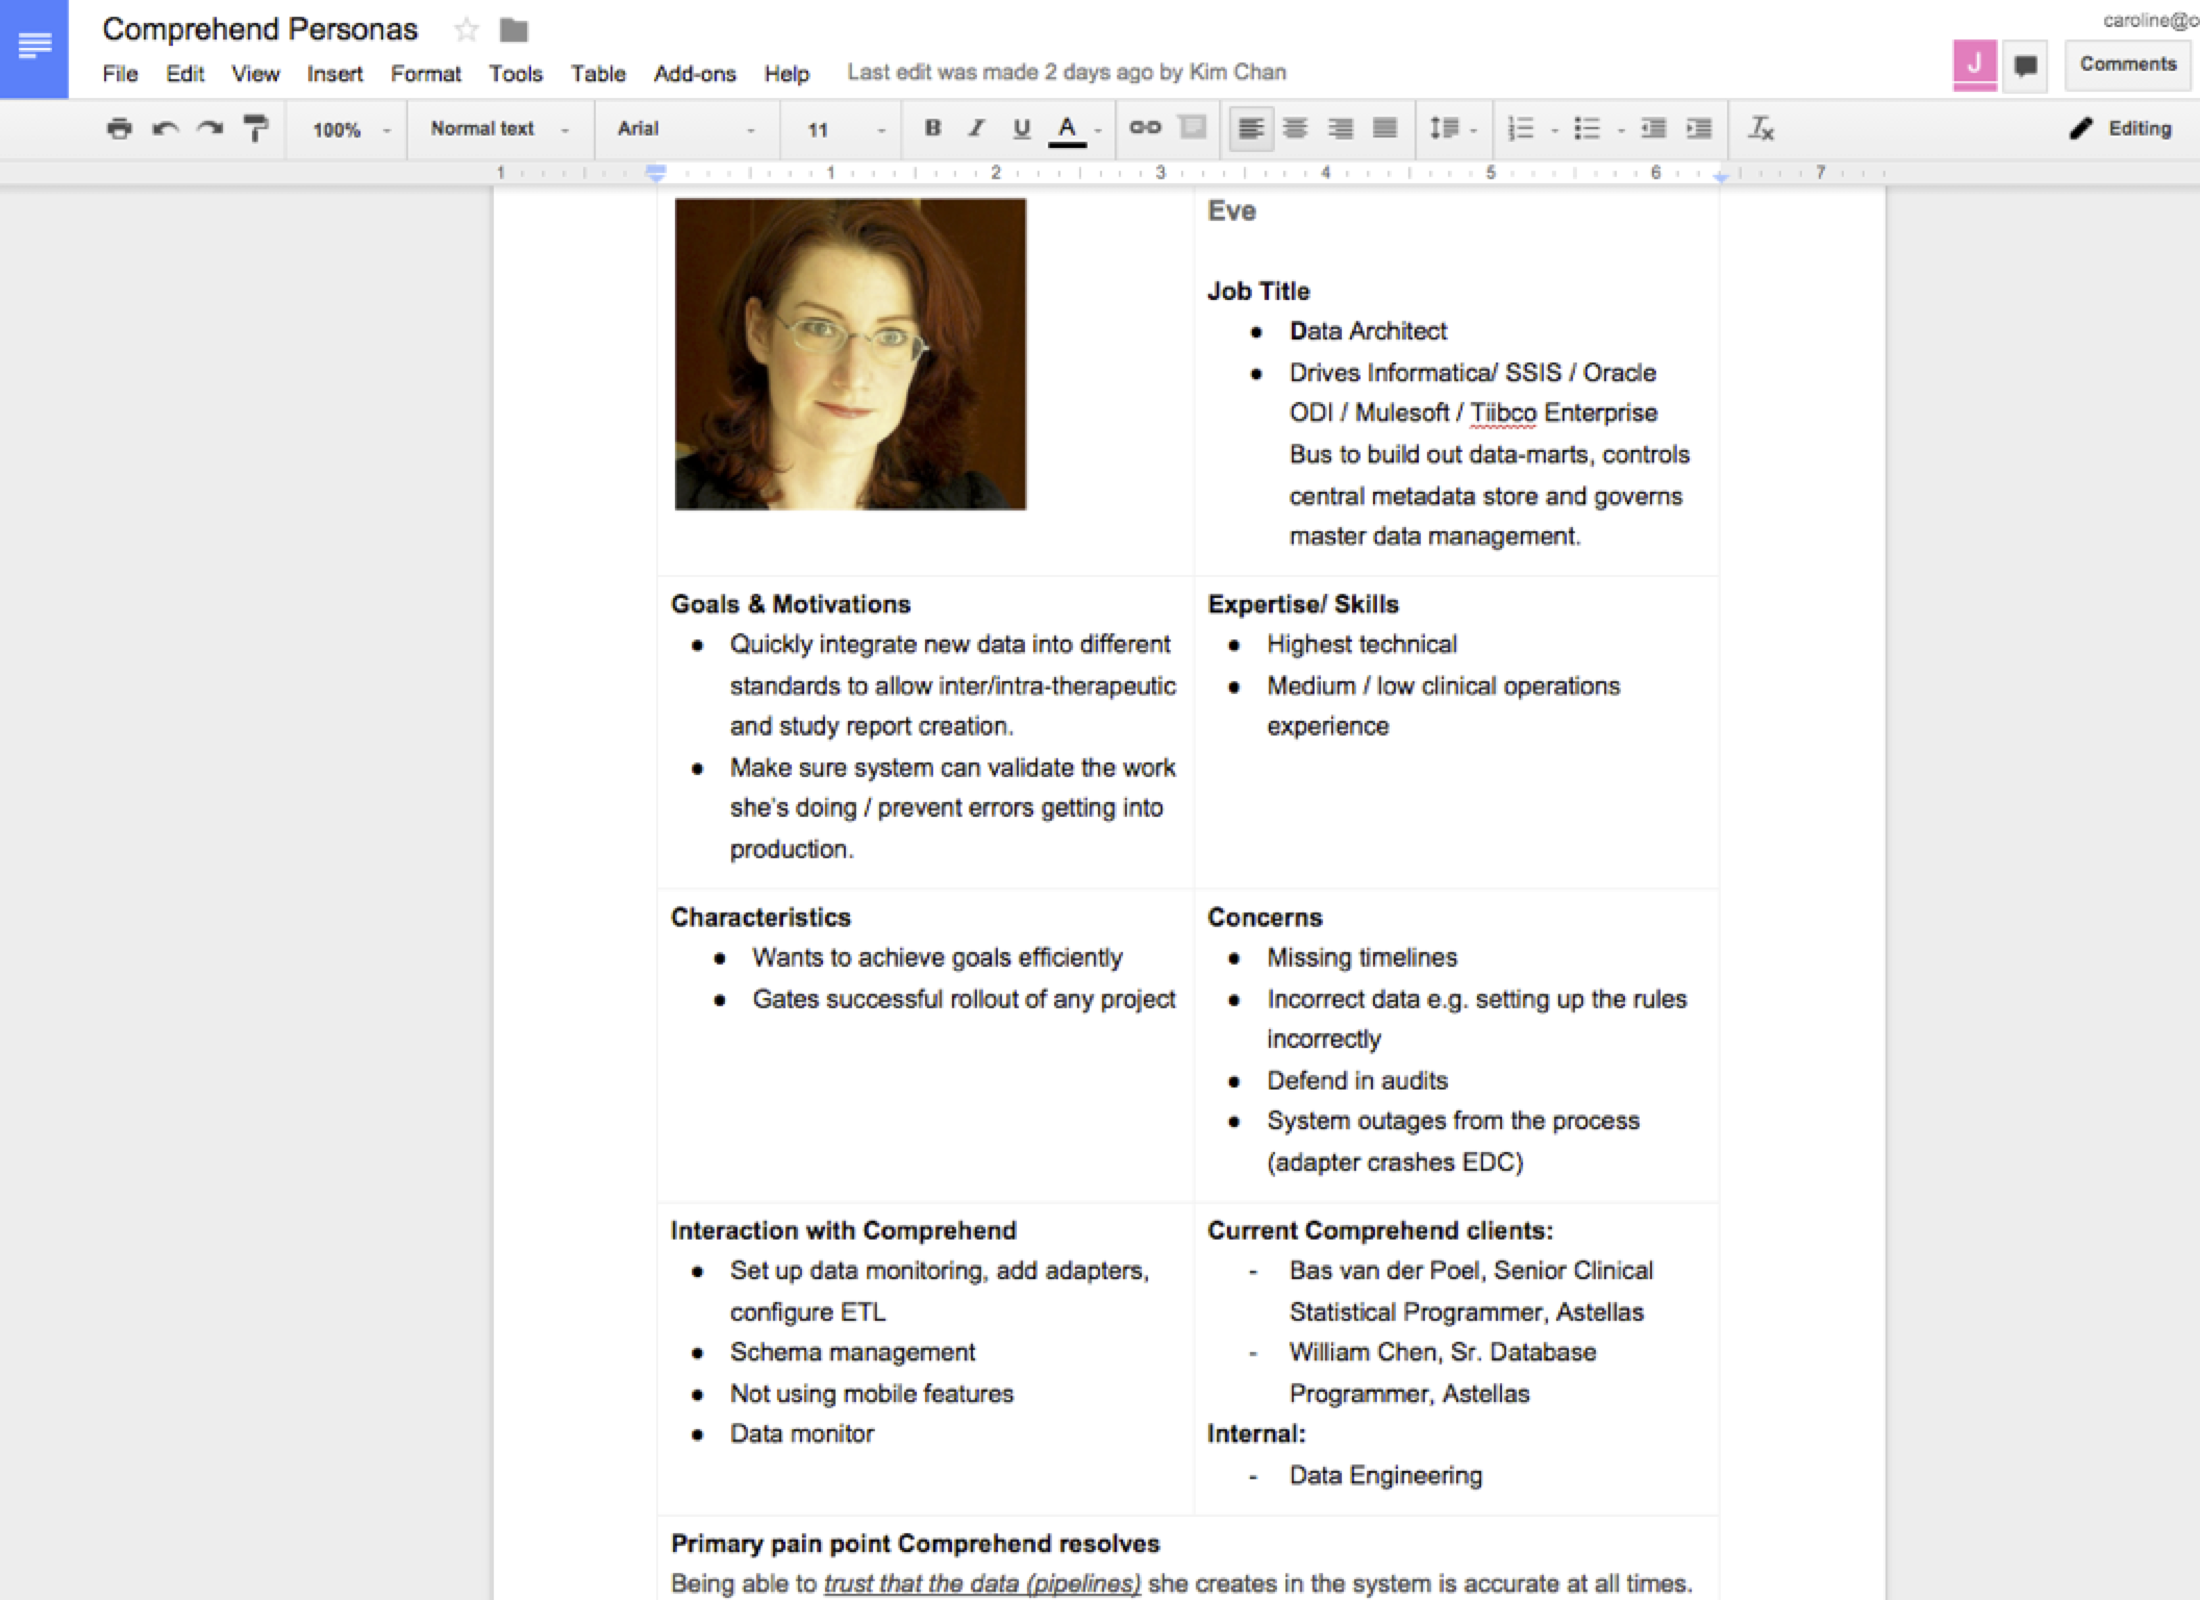
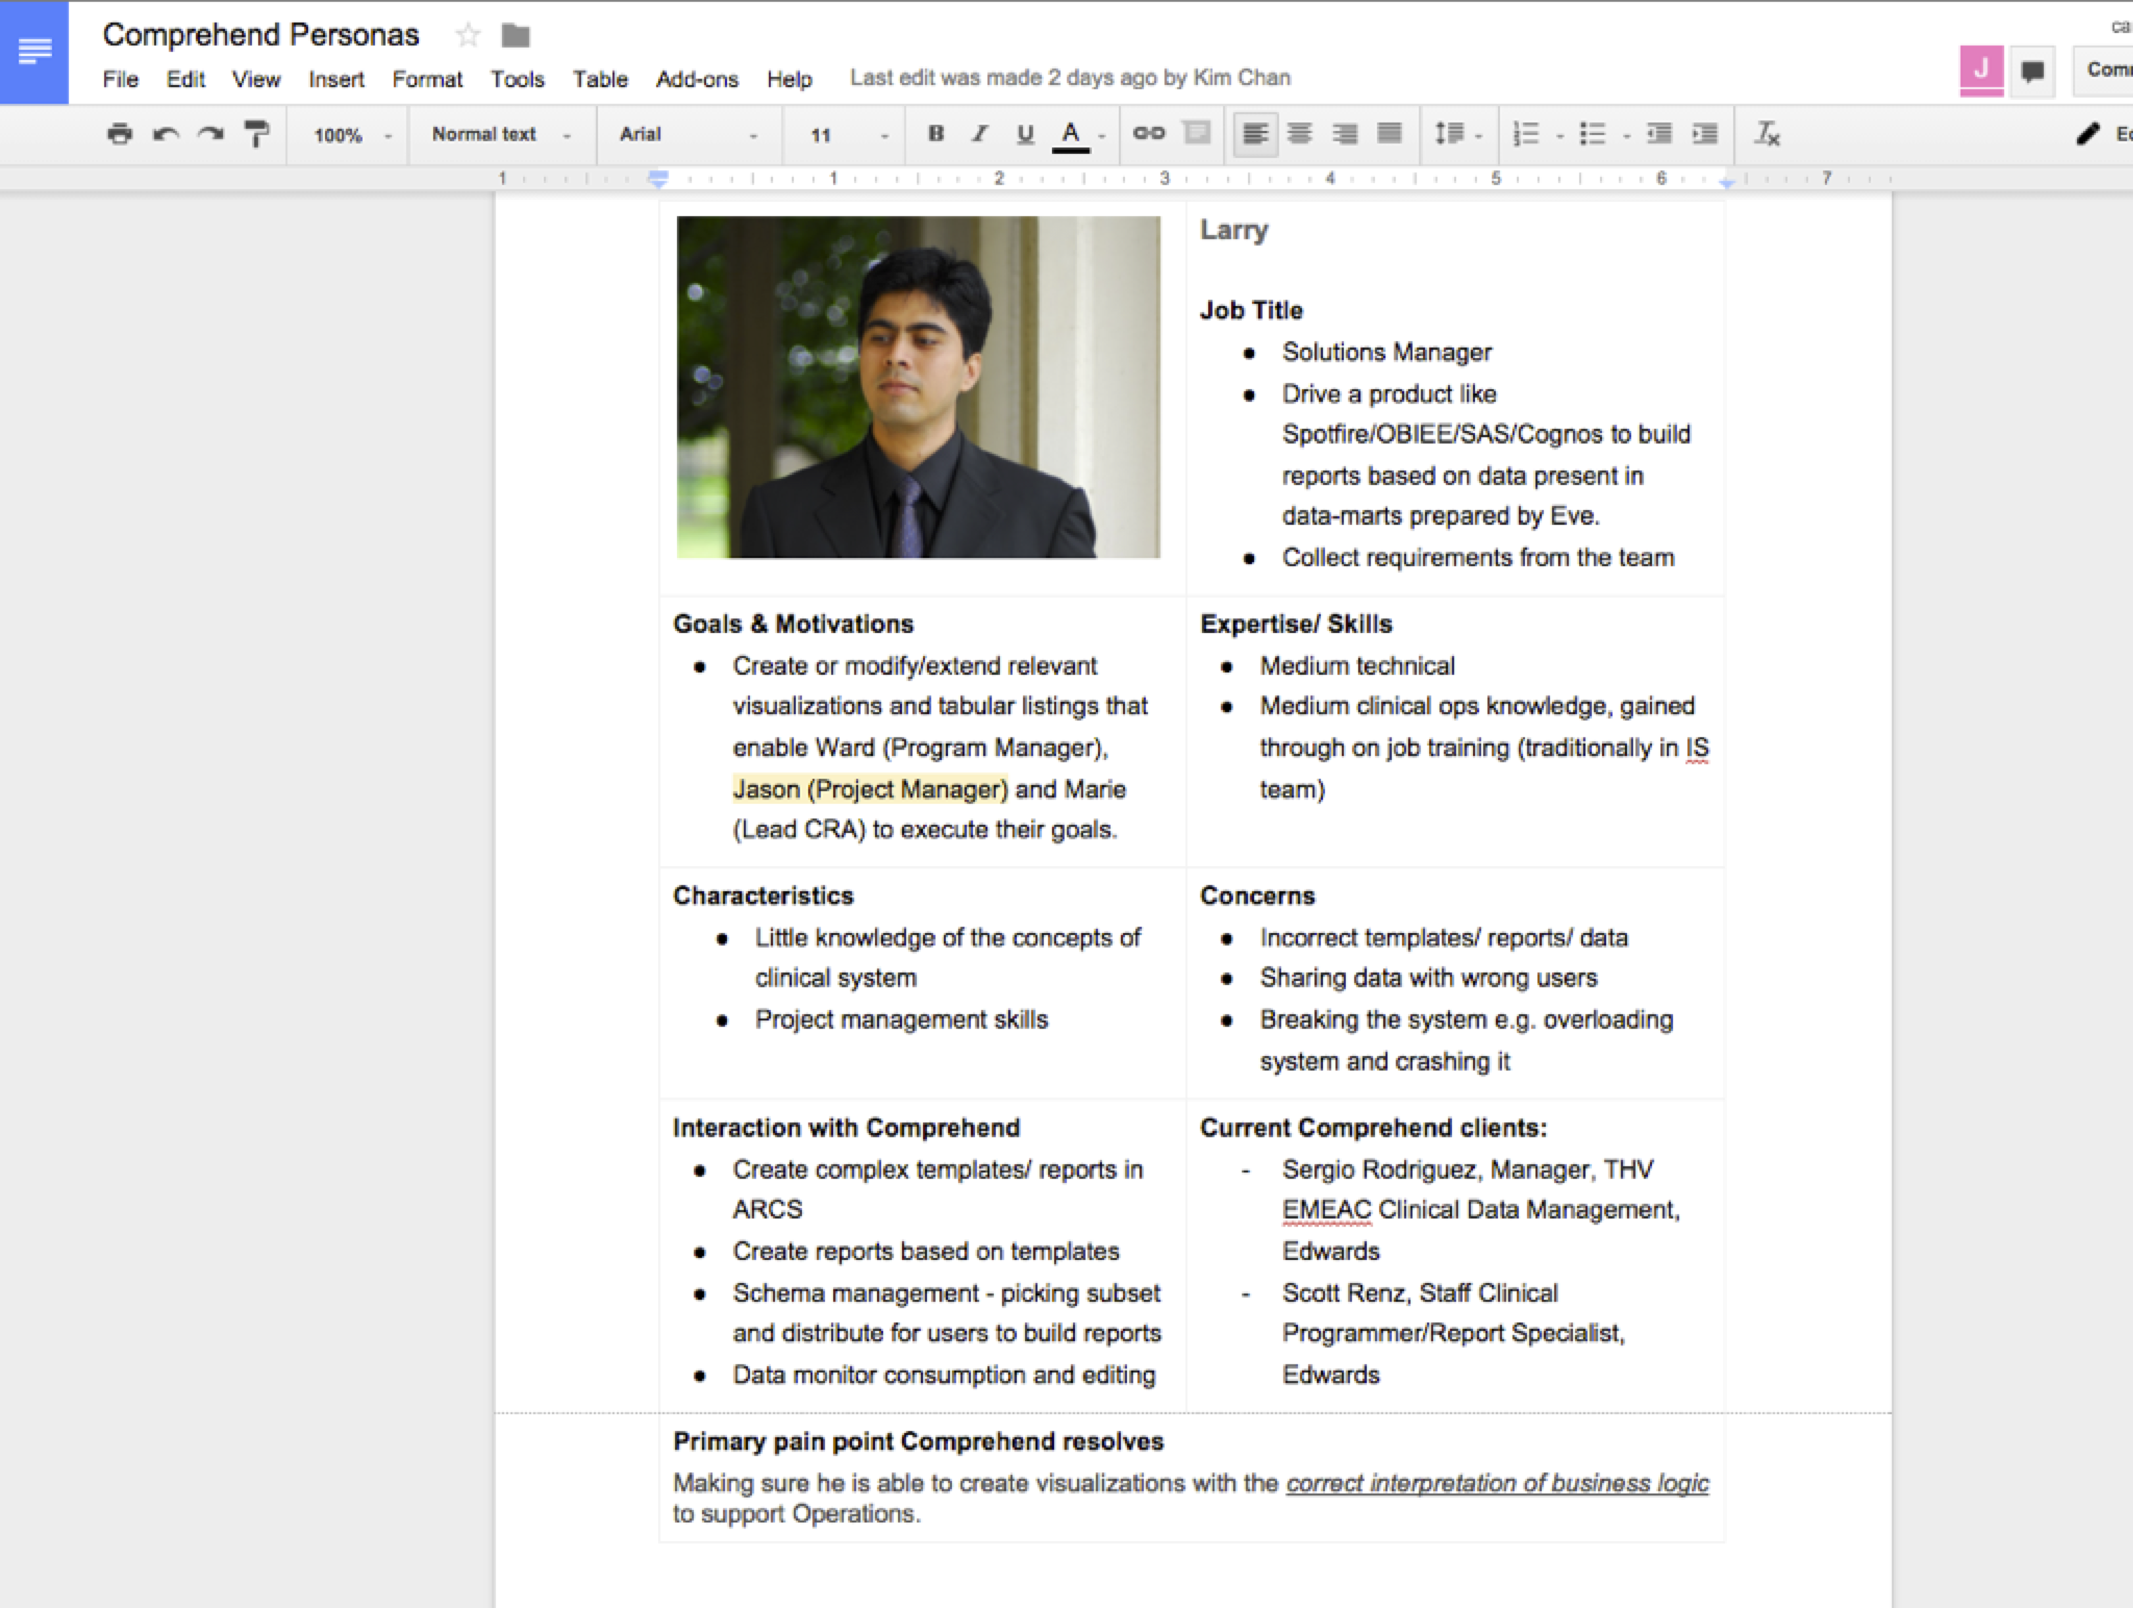
We talked to potential and existing customers as well as our internal customer support team, and determined that we needed to update our existing personas. We decided to design the product for one primary persona with considerations for a second. The primary persona, Eve, is a data architect that sometimes comes into the picture in larger organizations. She is highly technical and manages highly complex schemas, and she is the go-to person for setting up and modifying alerts.
The secondary persona, Larry, is familiar with Excel but has limited knowledge of clinical trials. Larry mostly relies on Eve to set up the alerts, though he has enough technical knowledge to modify existing alerts.
Visualization Types
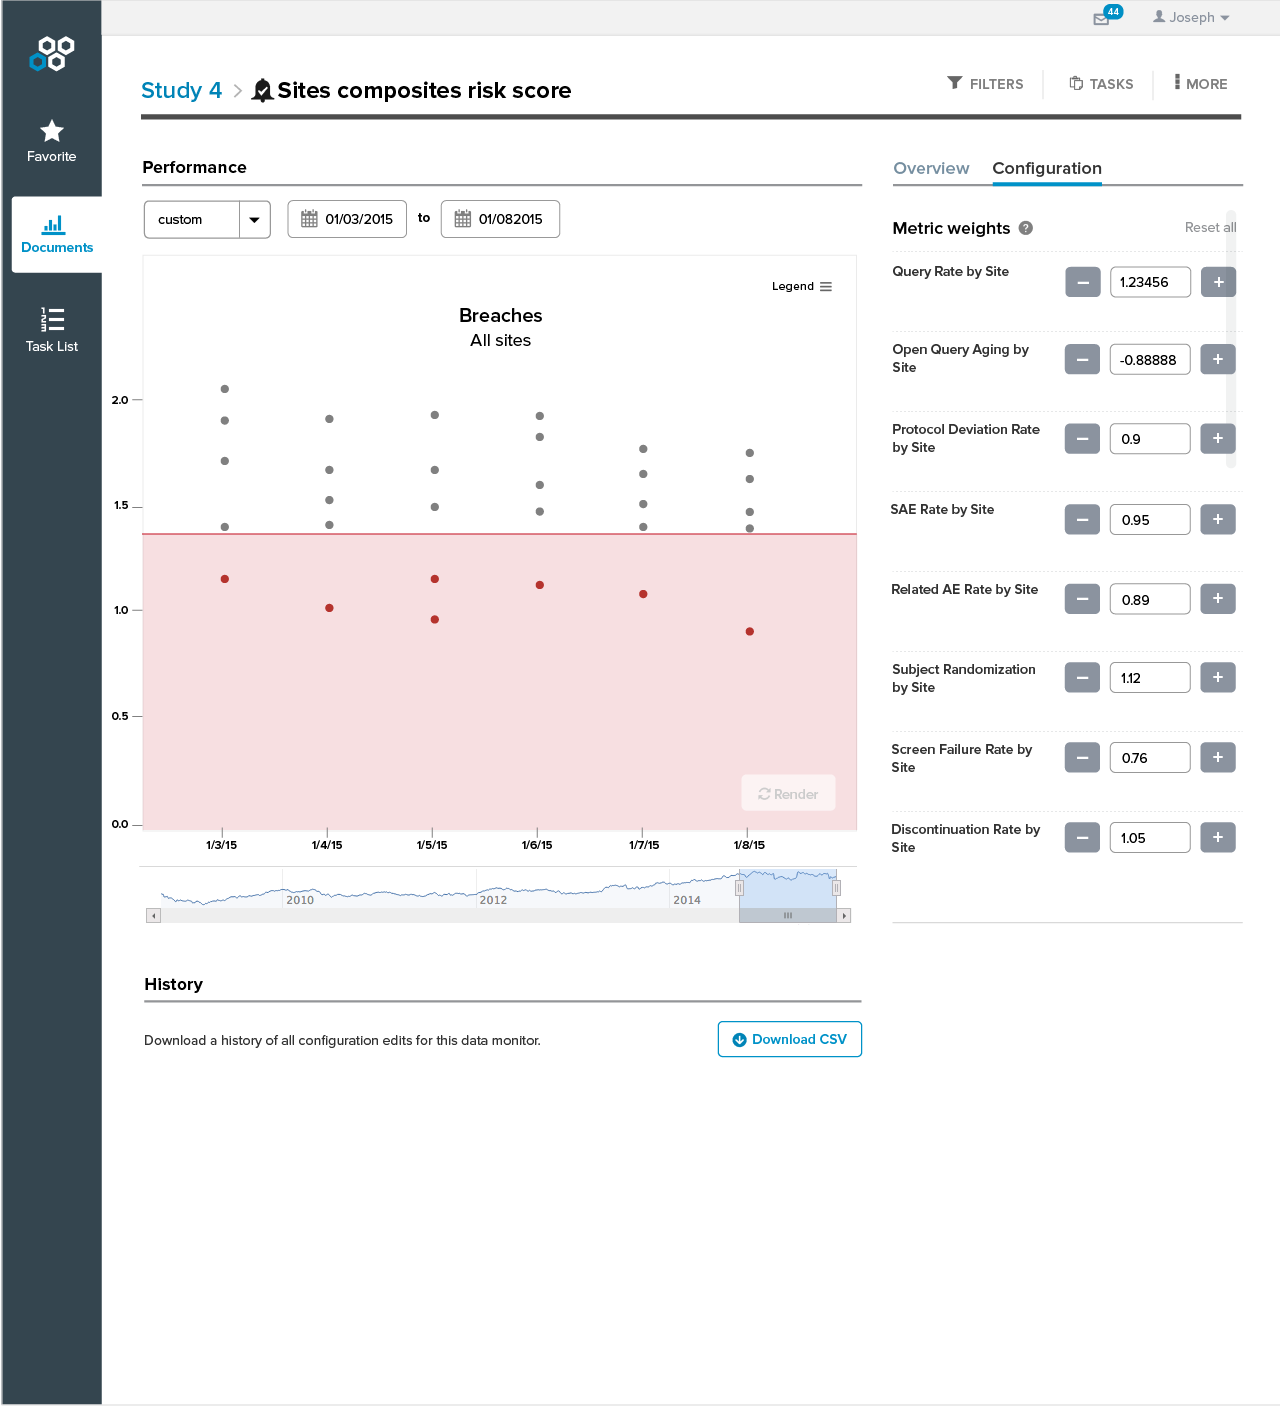
As soon as we incorporated realistic data into the design we realized there were many types of visualization needed. I created this matrix to describe the various permutations of visualizations that can occur, depending on the user-defined threshold type, filter status, breach status etc.

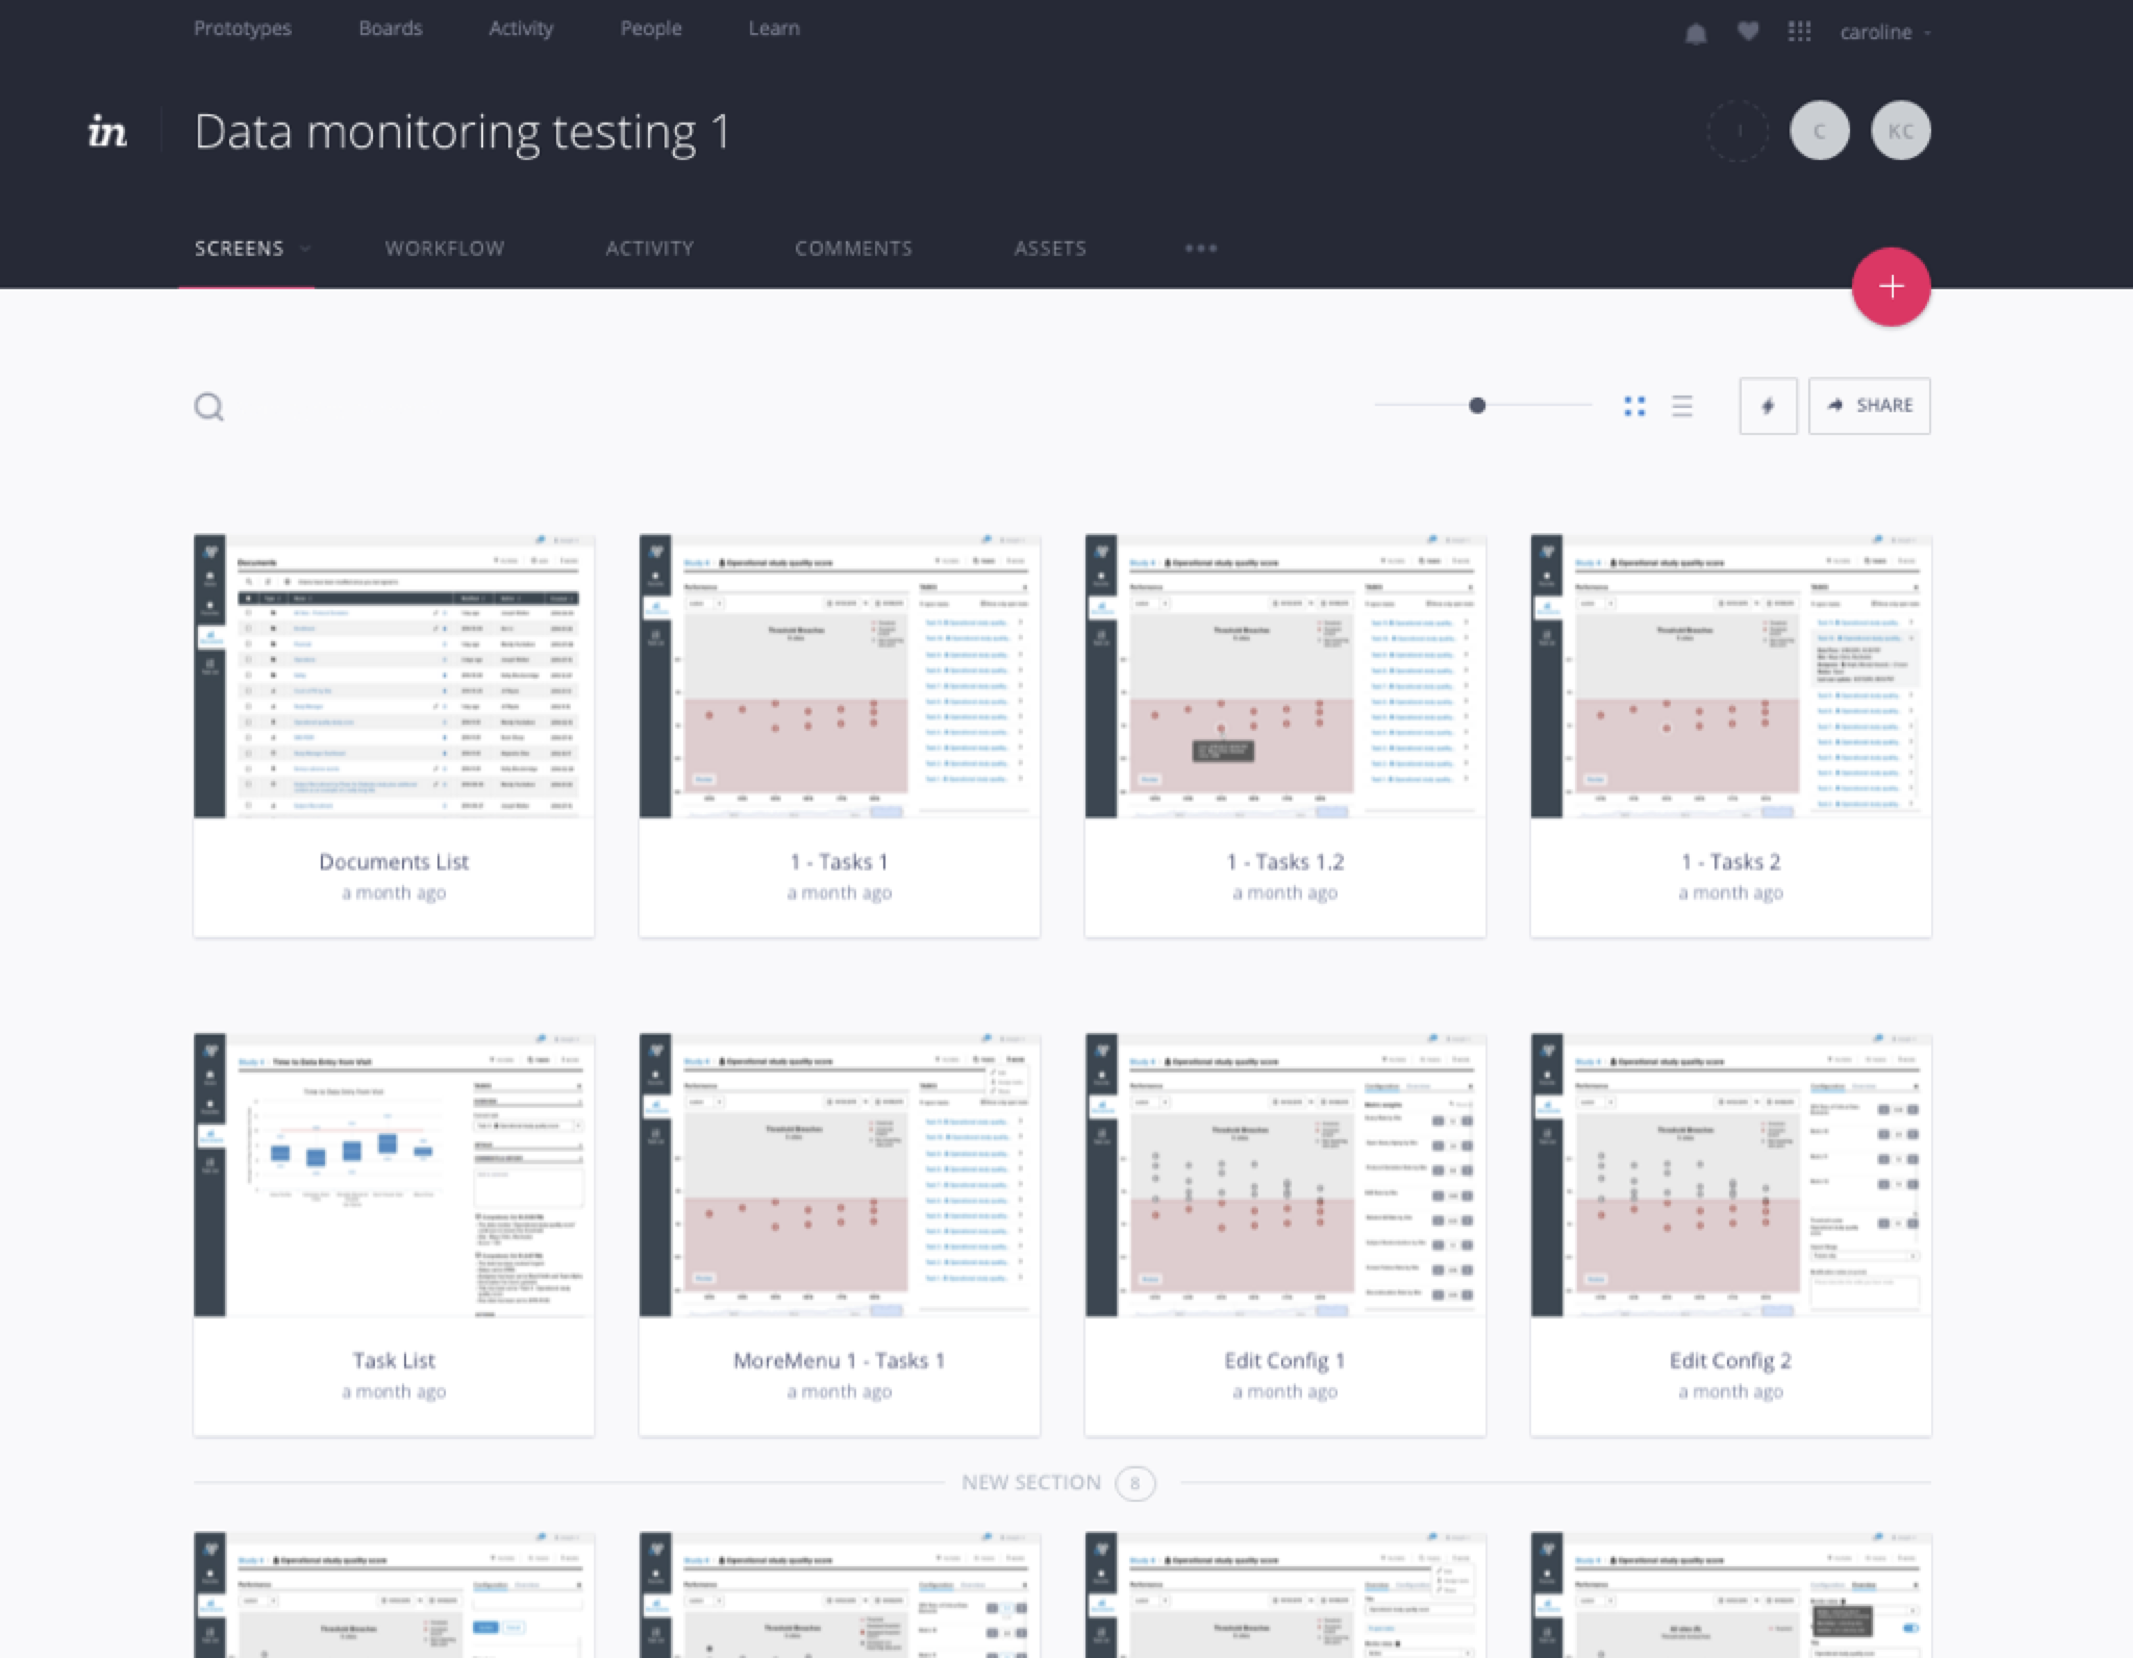
Interactive Prototypes
I ran weekly iterations with the product manager and a lead engineer throughout the entire design process. This design was complex and we were able to deep dive into technical discussions and iterate rapidly before going too far with the design directions.
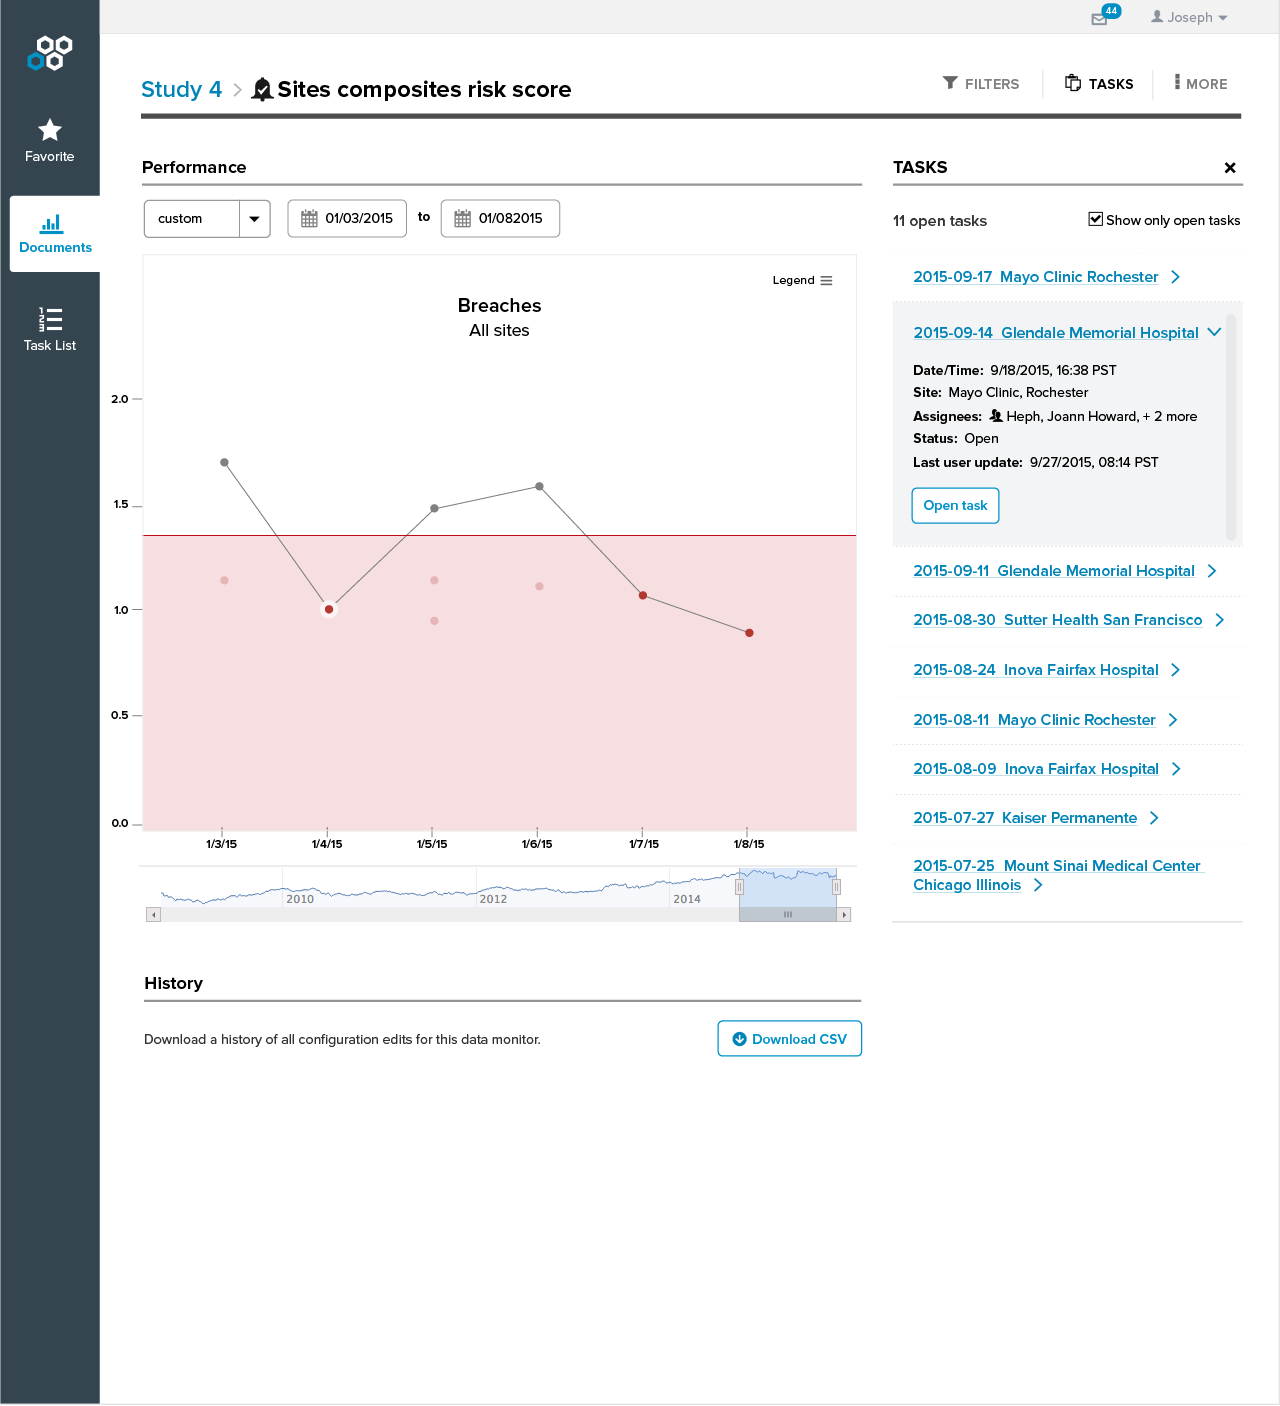
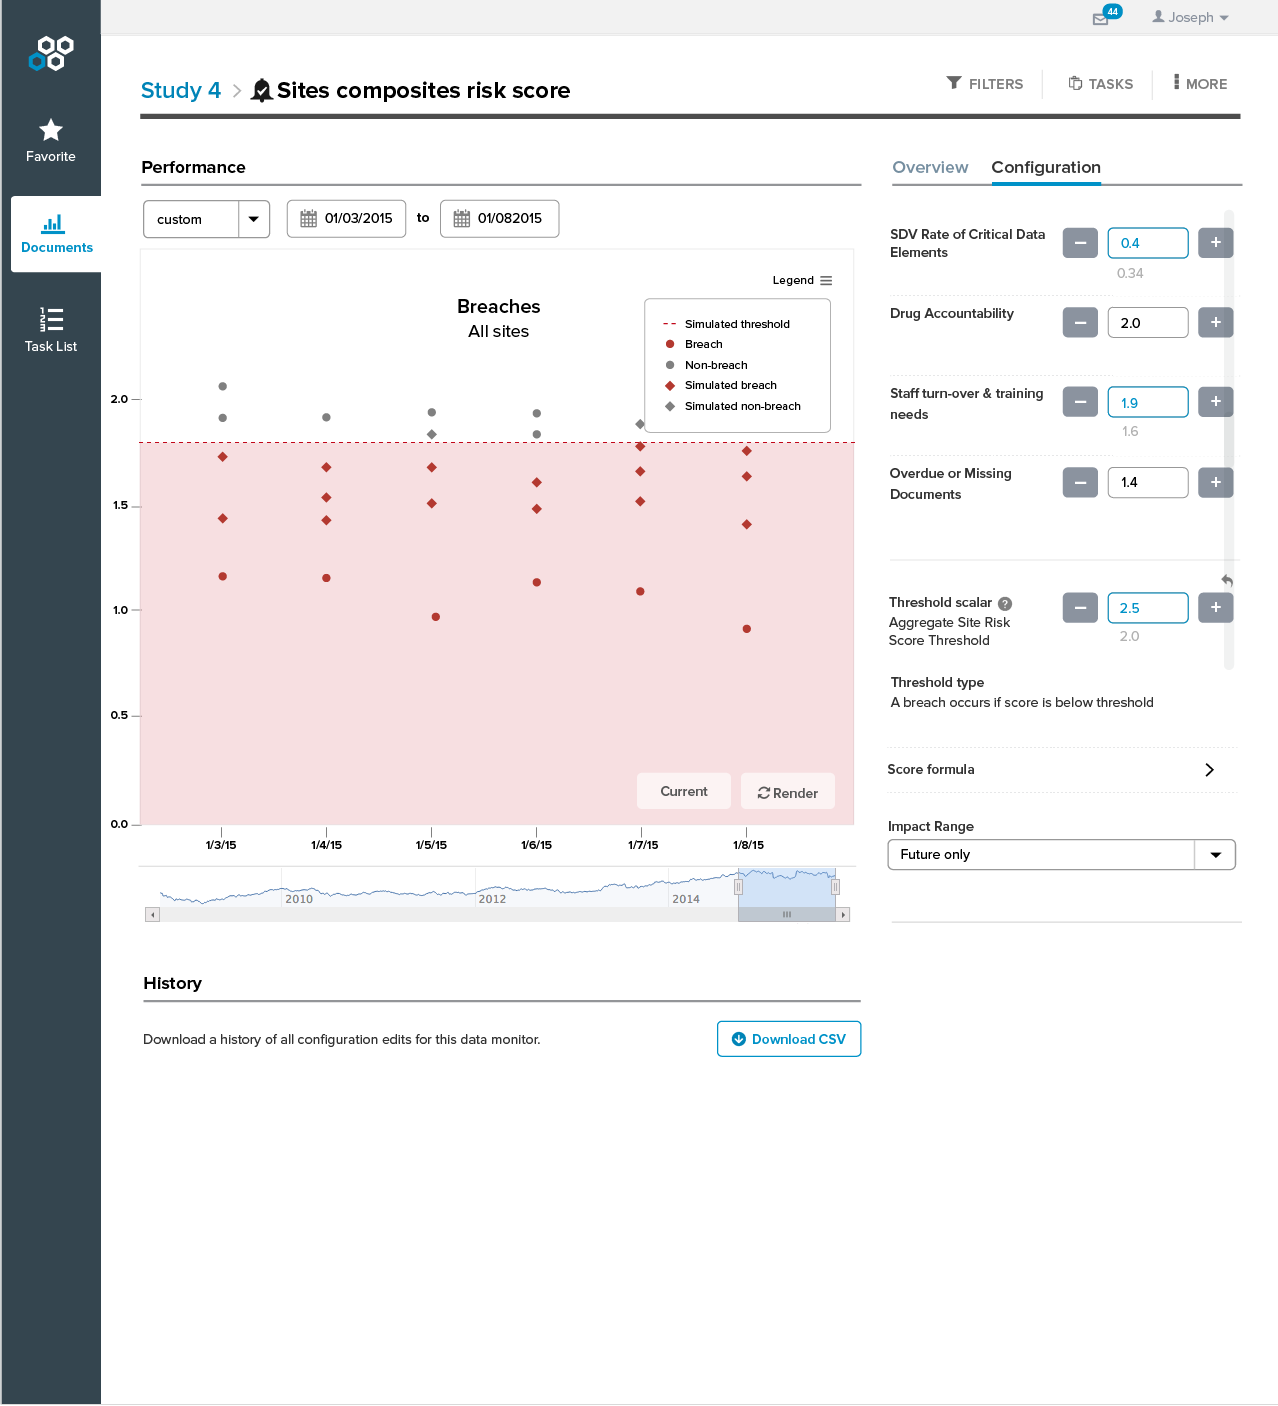
Simpler Does Not Always Mean Better
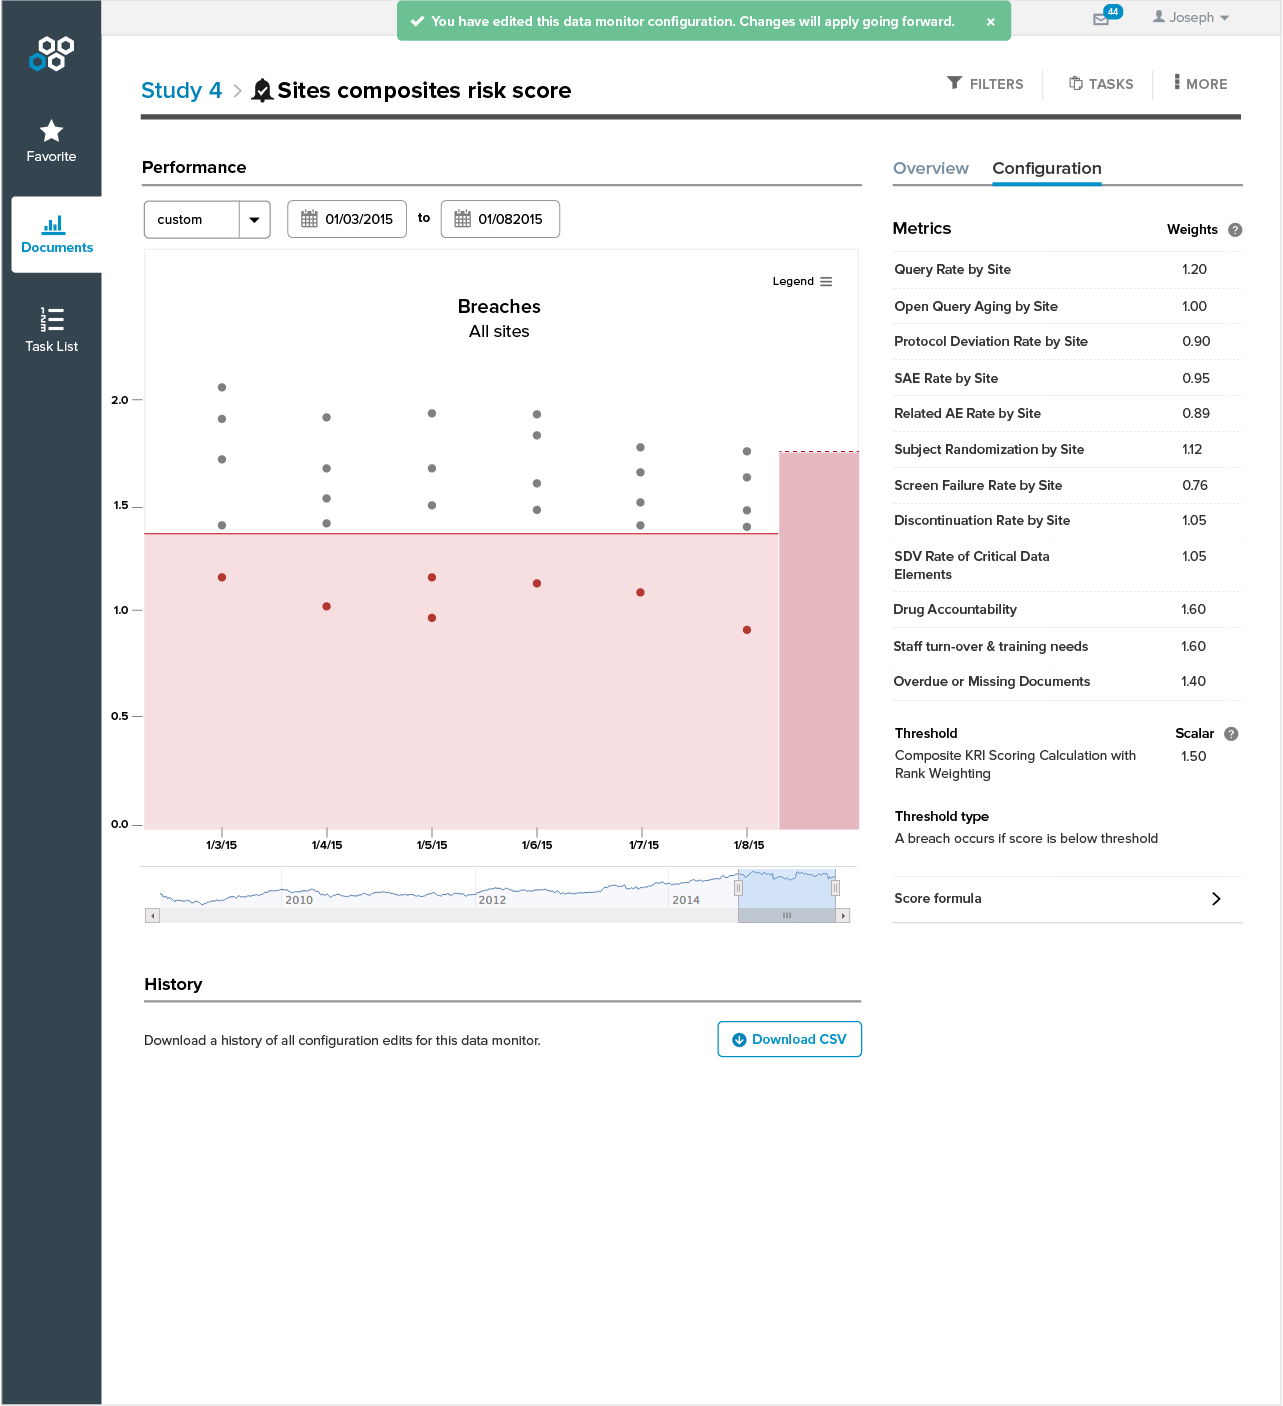
We ran two rounds of user testing during the project. Originally, we had decided to hide all non-breach data points in order to simplify the visualization. However, from the user feedback it was obvious that we needed to show the non-breach data to provide contexts. Additionally, we had assumed that a simpler visualization which separated the existing and simulated data was easier to digest. Again, we received consistent feedback that the existing data and the simulated data needed to be displayed simultaneously. We adjusted the design accordingly, and it was humbling to realize a simpler design does not necessarily mean a better design.
Results
To support development, I provided interactive prototypes, as well as specifications for interaction and visual design. In addition, I included all new UI elements in a style guide to ensure reusability. The feature was launched and we received very positive feedback.